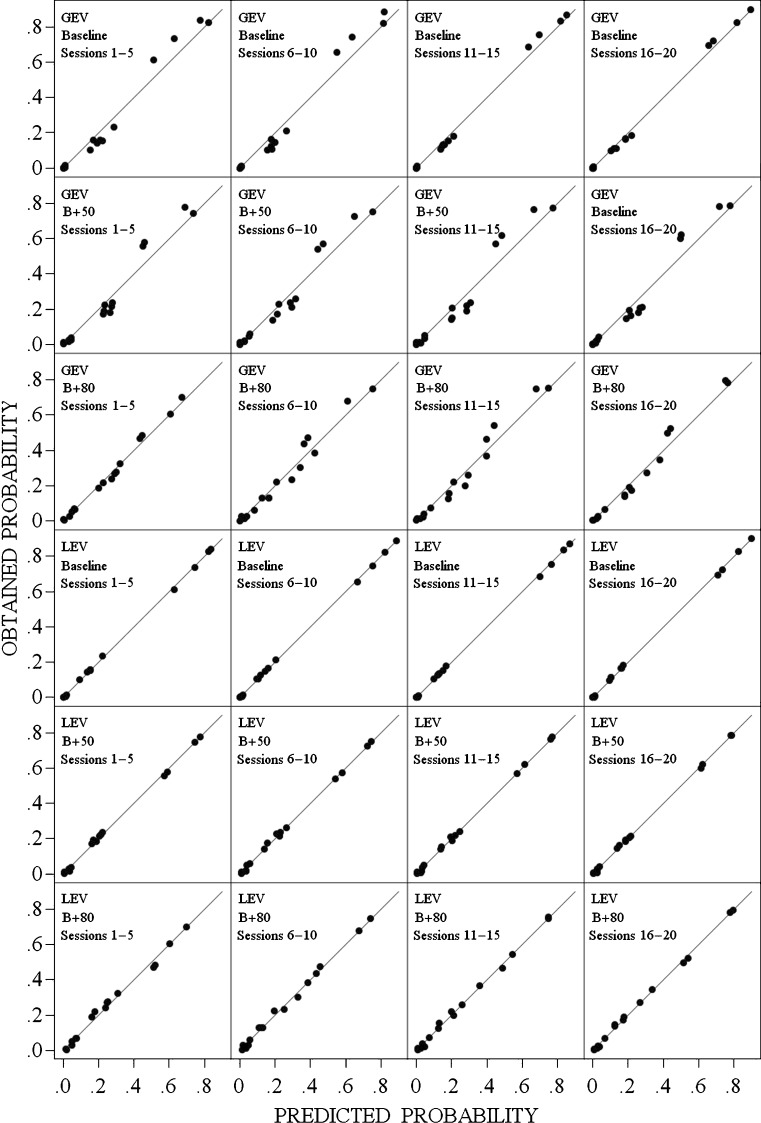
Fig. 4.
The obtained probability of response k, (1 ≤ k ≤ 4), given stimulus j, (1 ≤ j ≤ 4), for the 16 combinations of k and j, as a function of the predicted values of these probabilities obtained from the best-fitting Gaussian equal-variance model and from the best-fitting Laplace equal-variance model for the baseline, B + 50, and B + 80 conditions. The models in each condition were fit to the matrices of stimulus–response probabilities averaged over participants and sessions. The straight lines represent where the points would fall in these coordinates if the predictions of the model were perfect

