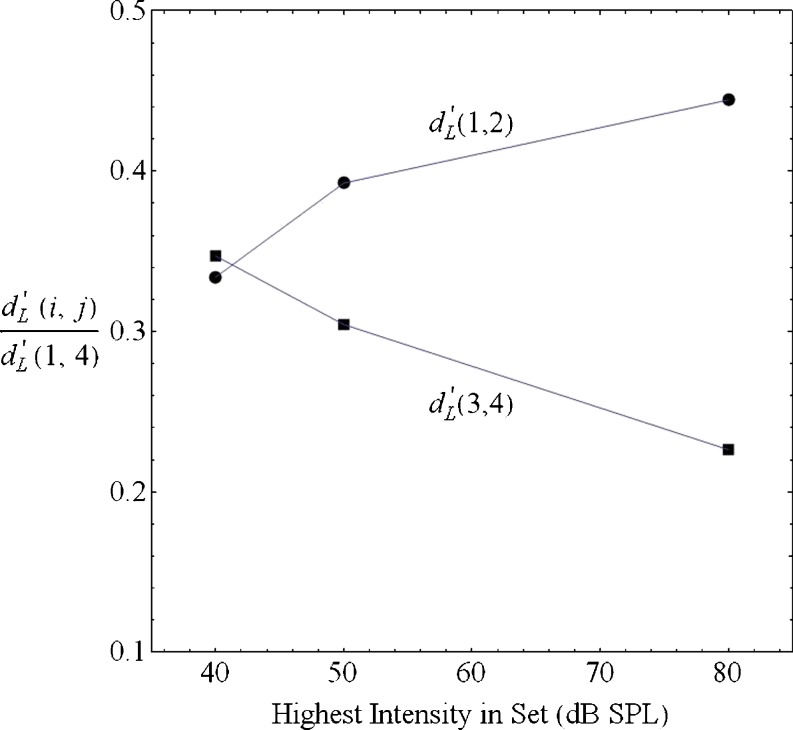
Fig. 6.
The Laplace d-prime distance in a condition between stimuli 1 and 2 (circles), relative to the Laplace d-prime range between stimuli 1 and 4 in the same condition, is plotted as a function of the intensity of the highest tone in that condition. Also shown is the equivalent plot for the relative Laplace d-prime distance between stimuli 3 and 4 (squares)

