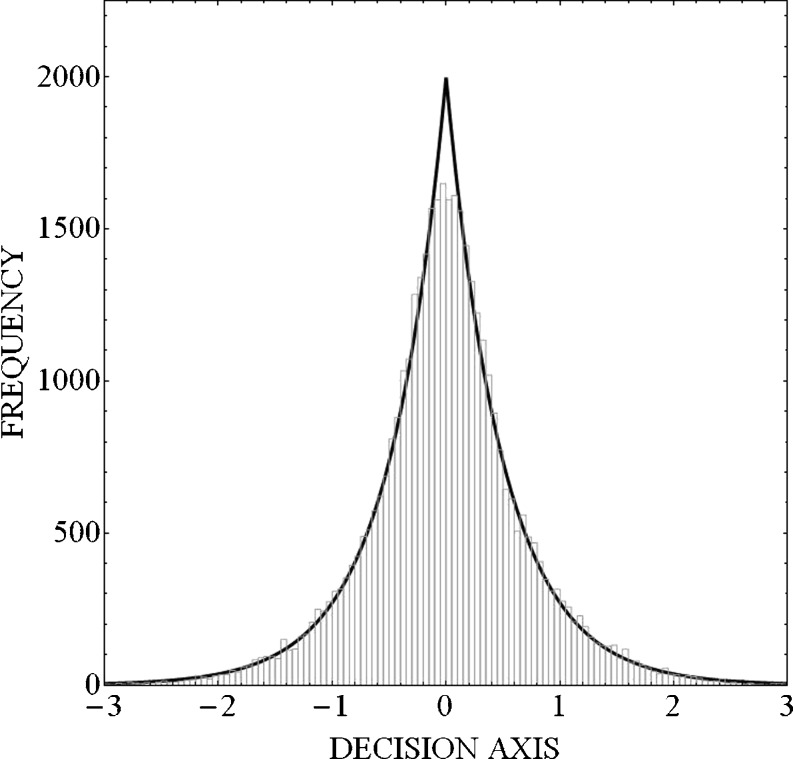
Fig. 7.
Frequency histogram for the aggregation of 10,000 samples from each of four normal distributions having the same mean (μ = 0) but different standard deviations (σ = 0.25, 0.50, 0.75, and 1.0, respectively). The smooth curve fit to this histogram is what we would expect if the aggregate data were generated from a single Laplace distribution

