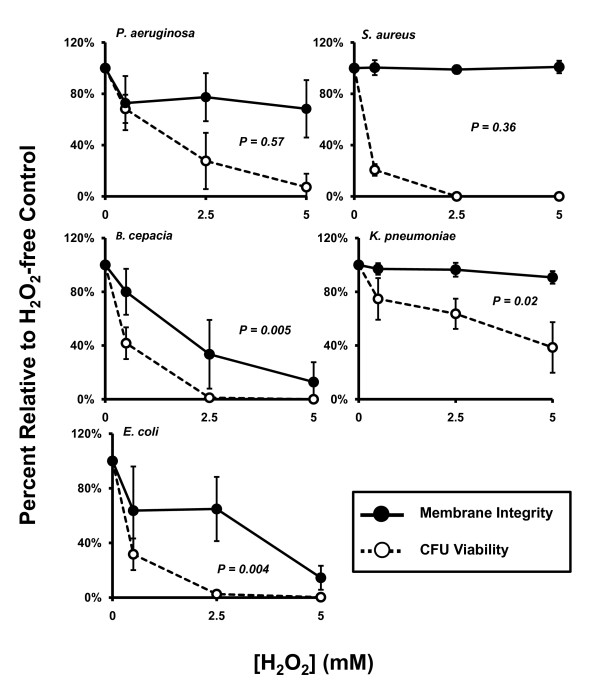
Figure 3.
Correlating H2O2-mediated membrane permeabilization and CFU viability. For BC, KP, and EC, loss of membrane integrity correlated statistically with decline in CFU viability while these two parameters were statistically independent of each other for PsA and SA. Solid circles and lines: membrane integrity. Open circles and dotted lines: bacterial viability. Both parameters were expressed as percent relative to oxidant-free controls. P-values represent linear regression of the raw data values from membrane permeability versus bacterial viability. Values less than 0.05 were considered significant and denote correlation between the parameters; values greater than 0.05 indicate independence of the parameters. Error bars represent standard deviation of at least n = 3 experiments.

