
Figure 5.
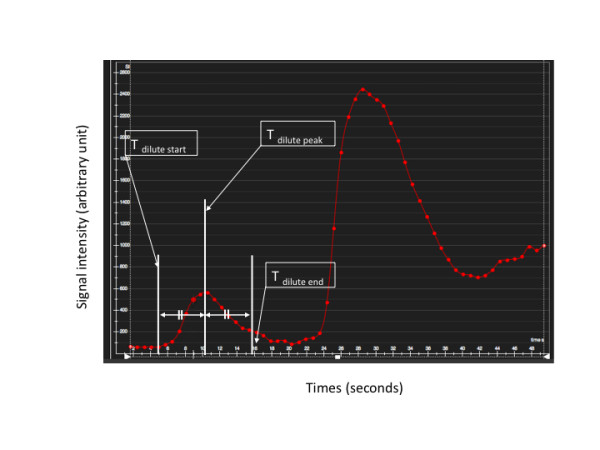
In the time-signal intensity plot, several time frames of interest from arterial input function curve are indicated: dilute start frame (T dilute start), dilute peak frame (T dilute peak), dilute end frame (T dilute end), neat start frame (T neat start). T dilute end was specified the time point as; (T dilute peak- T dilute start) + T dilute peak. The time width of dilute CA bolus curve (TW dilute) was defined as T dilute end - T dilute start.