
Figure 8.
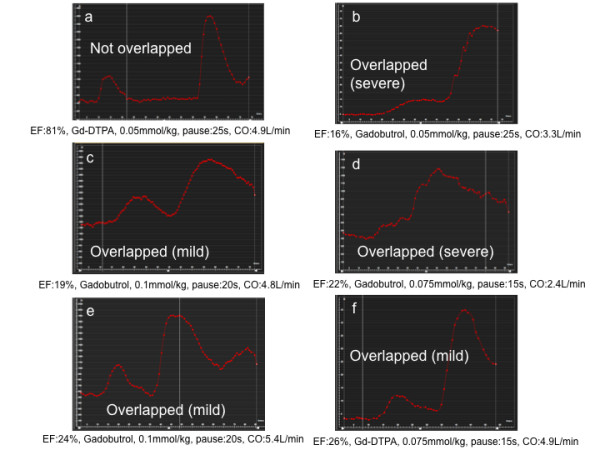
Time-signal intensity curves for dual-bolus perfusion scan at rest in a patient with hyper contractile LV EF (>80%) (a) and with low LV EF (<30%) (b, c, d, e, f) are shown. The information under each curve is ordered as EF, contrast agent, dose, predefined pause, CO (EF: ejection fraction, CO: cardiac output). In the patient with hyper contractile LV EF, two curves, namely, dilute and neat CA bolus, are well separated. However, in the patients with low LV EF, these two curves are overlapped with a various extent regardless of CA dose and predefined pause duration.