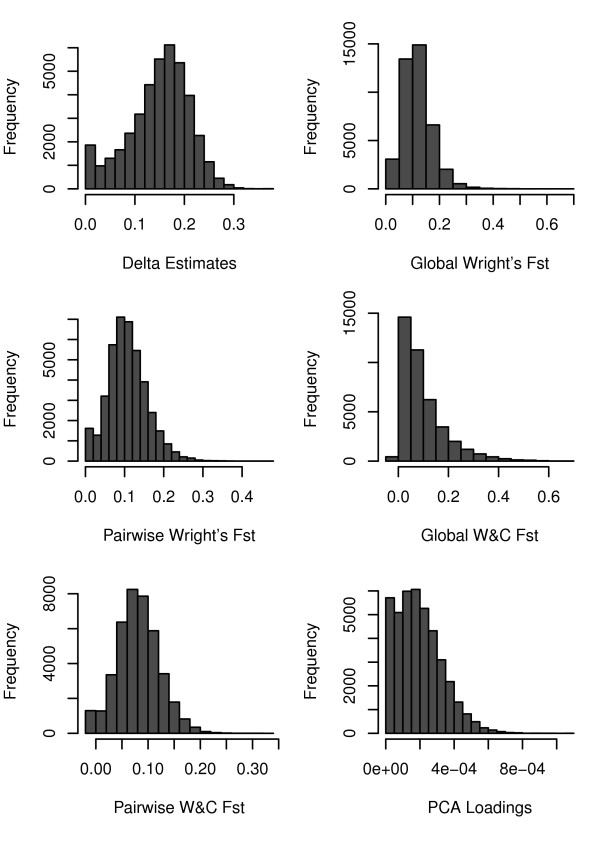
Figure 1.
Frequency histograms of the estimates of genetic information contained in each SNP marker, for each selection method (x-axis scale is method-specific). The majority of the SNP markers display low to moderate estimates of genetic informativeness with few markers displaying high levels of population differentiation.

