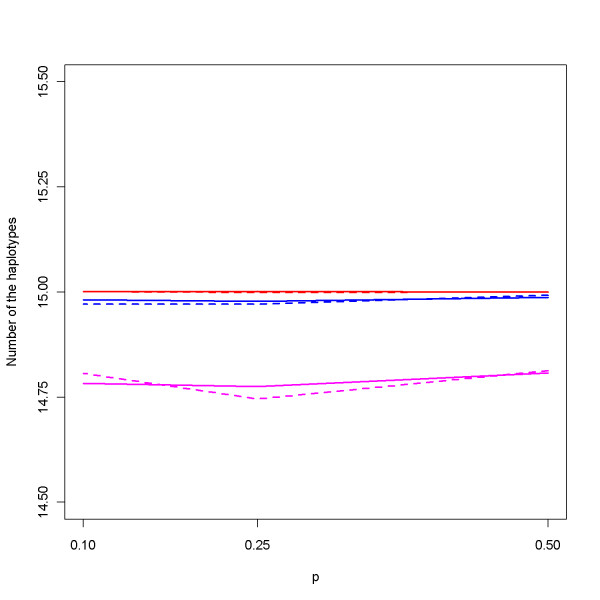
Figure 4.
Average number of identified haplotypes under the additive model. The number of haplotypes identified in the simulations under various numbers of families (N), relative ratios (r), and liability allele frequencies (p) under additive models. Red lines are for N = 200 families, blue for N = 100 families, and pink for N = 50. Solid lines are for r = 2 and dashed lines for r = 3.

