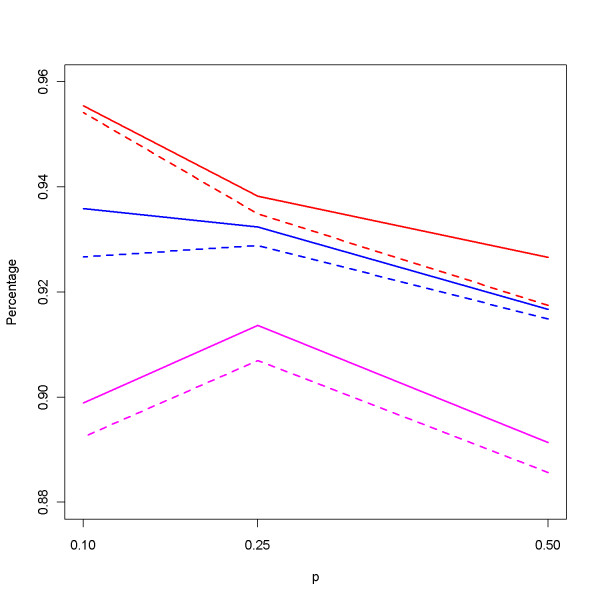
Figure 5.
Average of percentage of identified core haplotypes. The average percentage of identified core haplotypes among the 10 true core haplotypes under different allele frequencies p. Red lines are for N = 200 families, blue for N = 100 families, and pink for N = 50. Solid lines are for r = 2 and dashed lines for r = 3.

