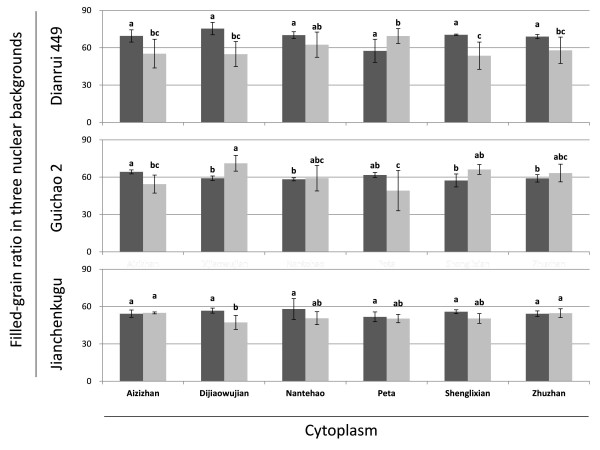
Figure 1.
Mean filled-grain ratios for six cytoplasms in three nuclear backgrounds at two locations. The left, grey bar in each pair represents the mean in Sanya: the right, black bar represents Kunming. Within each location-nuclear background combination, mean bars labeled with different letters are significantly different at the P = 0.05 level.

