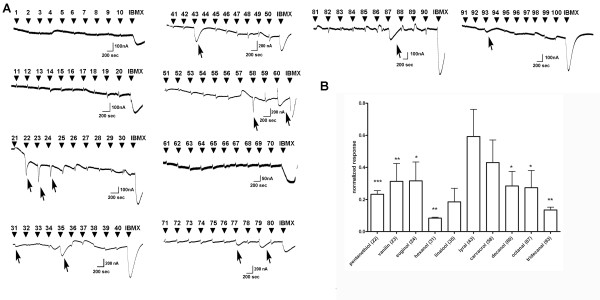
Figure 3.
Current responses to 100 odorants in oocytes injected with plasma membranes from ventral region, endoturbinates. A. Representative traces. Odorants were applied at 300 μM, for 15 sec and at -70 mV holding potential. Odorant number is shown at the indicated time of application. At the end of the each run, 1 mM IBMX was applied for 5 sec. Arrows indicate responses. B. Current responses of ventral region were normalized to the IBMX response in each oocyte (n = 3-8, mean ± SEM). As a control, M1 receptor was injected and tested for the same odorants (n = 8, mean ± SEM). Significant differences when compared to M1 receptor responses were indicated as * for p ≤ 0.05, ** for p ≤ 0.001 and *** p ≤ 0.0001.

