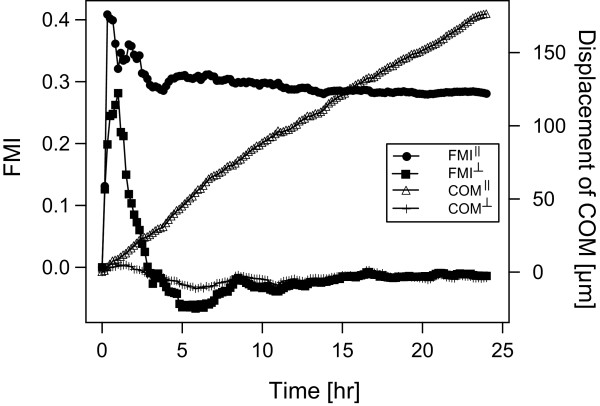
Figure 6.
Time development of ┴ and ║ components of COM and FMI in one representative HT-1080 chemotaxis group (+/-) (data from Figure 4B). The FMI║ increases volatile during five hours at the beginning of the experiment and remains nearly constant afterwards. COM║ increases during the whole experimental time with a constant slope. Both, COM┴ and FMI┴ level off around zero indicating no directed migration perpendicular to the direction of the gradient.

