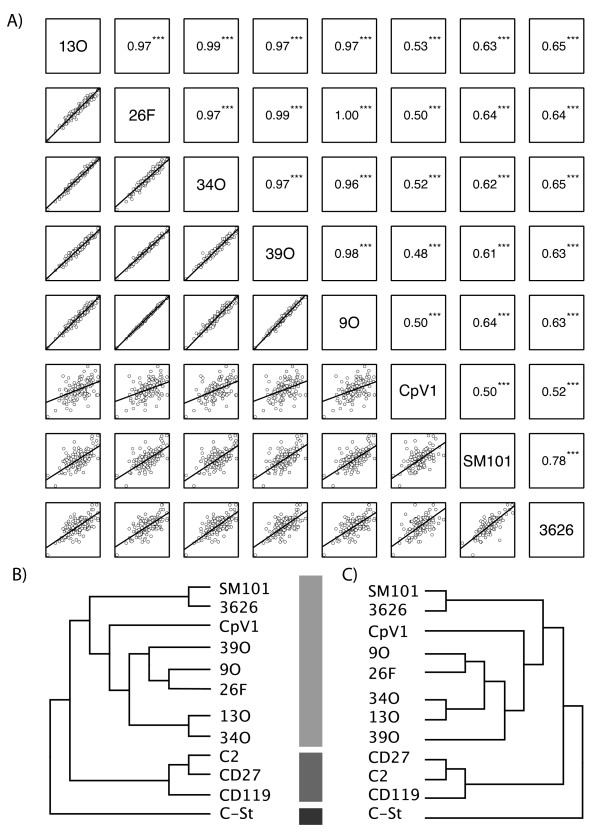
Figure 1.
Whole-genome comparisons of Clostridial phages. A) Tetranucleotide-based comparisons of five genomes sequenced by our lab (ΦCP13O, ΦCP26F, ΦCP34O, ΦCP39O, ΦCP9O) to three other publicly available C. perfringens phage genomes (ΦCPV1, ΦSM101, Φ3626). Lower panel shows scatter plots with linear models fitted to the 256 tetra-nucleotide z-scores for each pairwise genomic comparison. Upper panel represents Pearson correlation coefficients and significance (*** = p < 0.001) of correlations. B) Cladogram representation of correlation matrix of tetranucleotide distributions from (a) with additional comparisons to C. difficile phages (ΦC2, ΦCD27, ΦCD119) and a C. botulinum-infective phage (ΦC-St). C) Proteome-based cladogram comparing the same phage genomes as in (b). Tree is based on all-versus-all sequence similarity comparisons of gene predictions using a custom analysis pipeline as fully described in the text. Note consistent and symmetrical topology of trees in (b) and (c) and consistent relationships to host as shown by shaded vertical bars.

