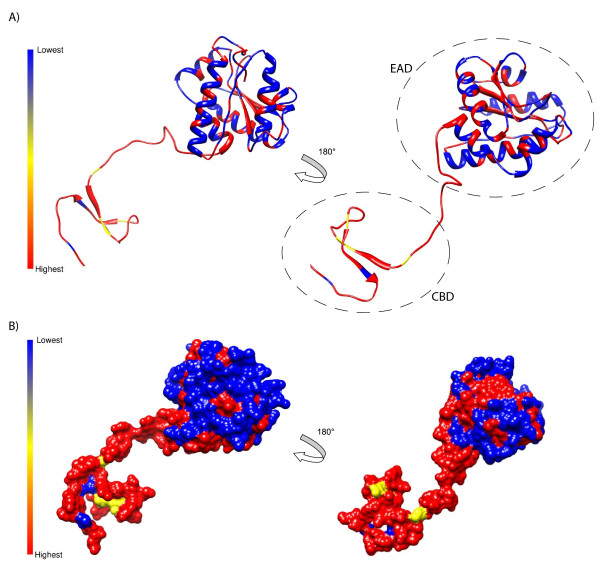
Figure 7.
Three-dimensional structures indicating amino acid conservation for Clostridium bacteriophages ΦCP9O, ΦCP13O, ΦCP26F, ΦCP34O, and ΦCP39O. Percent sequence conservation among the five phages is shown from highest 100% (red) to lowest 60% (blue) for cartoon (A) and surface based (B) models. Dashed circles illustrate the putative enzymatically-active domain (EAD) and the putative cell-wall binding domain (CBD). Low sequence conservation represents regions under high diversifying selection, primarily in the enzymatically-active domain.

