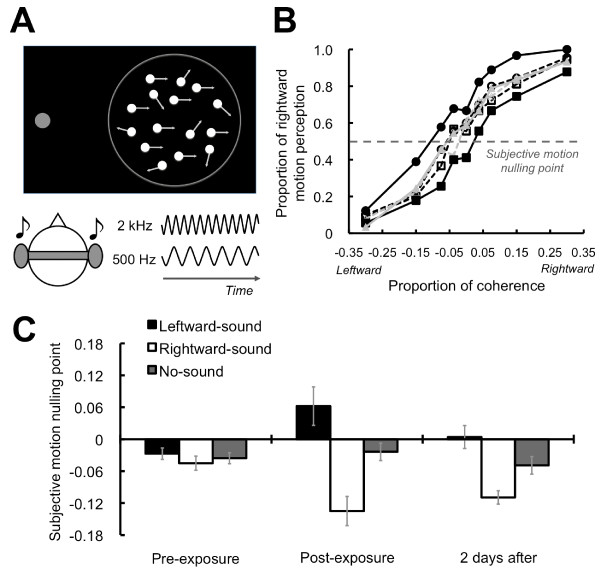
Figure 1.
Schematics of stimuli and results for exposure effects. (A) Visual global motion display was presented with a fixation circle. Tones of 2 kHz or 500 Hz were delivered through headphones. (B) Psychometric functions. In horizontal axis, negative values indicate leftward visual motion, and positive values indicate rightward motion. Each symbol represents the conditions. Circle: rightward-sound, square: leftward-sound, and triangle: no-sound condition. Filled symbols and solid lines indicate after-exposure data, while open symbols and dashed lines indicate pre-exposure data. Point of 50% responses was estimated as subjective motion nulling points (SMNPs). (C) SMNPs. Error bars denote the standard error of the mean.

