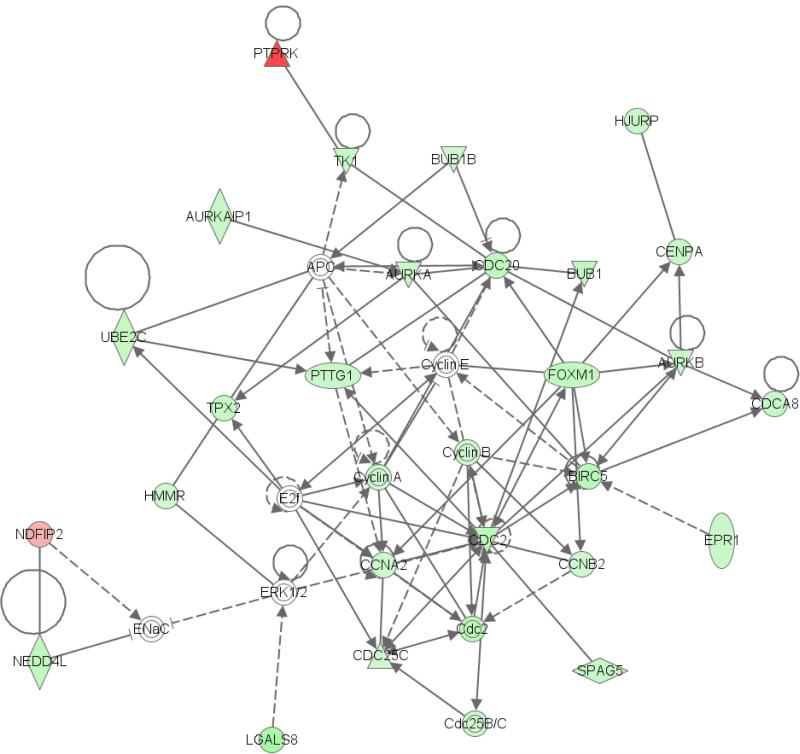
Figure 4.
Pathway analysis links the differentially expressed gene signatures of the MED29 transduced Hs 700T and MIAPaCa-2 cells to a cellular network involved in cell cycle, cancer, and genetic disorder. This network is characterized by involvement of several cyclins and other cell cycle related proteins, most of which are downregulated through MED29 expression. Green color indicates downregulation and red color upregulation. Lines and arrows indicate connection and dashed lines a weaker connection.

