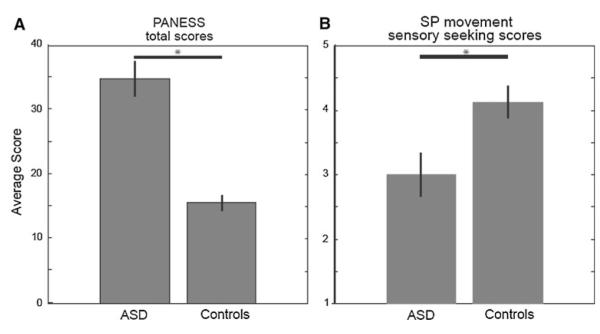
Fig. 2.
Group performance on motor and sensory assessments. a The ASD group averaged higher total PANESS scores than did the control group, denoting worse performance (p < 0.001). b The ASD group averaged lower movement “sensory seeking” scores on the Sensory Profile, suggesting hypersensitivity and more passive behaviors (p = 0.014). Error bars represent standard error

