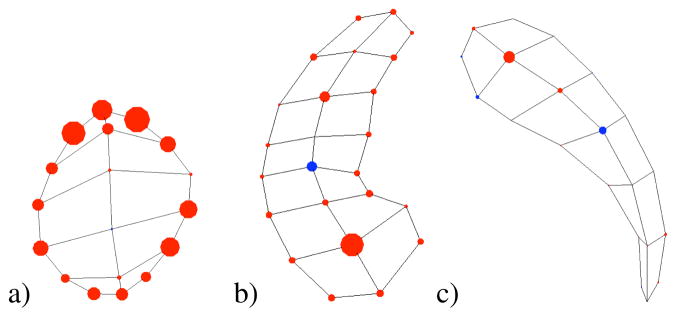
Fig. 16.
Visualization of radii change from autism to control in a) right amygdala, b) right hippocampus, c) right caudate. Size of ball at an atom position is proportional in size to the log of the control’s radius minus the log of the autism’s radius. Red is an increase in radius from autism to control and blue is a decrease.

