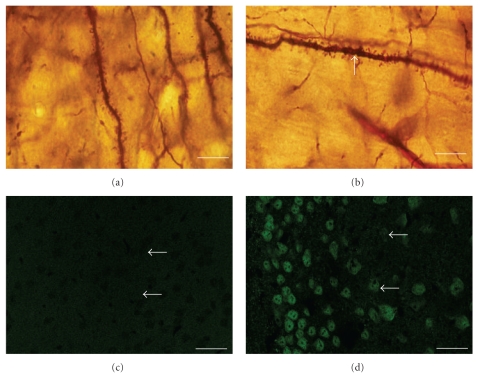
Figure 12.
Photomicrograph of cortex pyramidal cells with Golgi stain. (a) Dendrite with spine dendrite in a control. (b) Exposure to vanadium, area with spine dendritic loss (arrow). (c) Image from a section of the cerebral cortex in control mice (confocal): the neuronal bodies (arrows). (d) Pyramidal cell neurons exposed to vanadium stained with 4-HNE (arrows). Scale bars: (a), (b) 10 μm; (c), (d) 50 μm.

