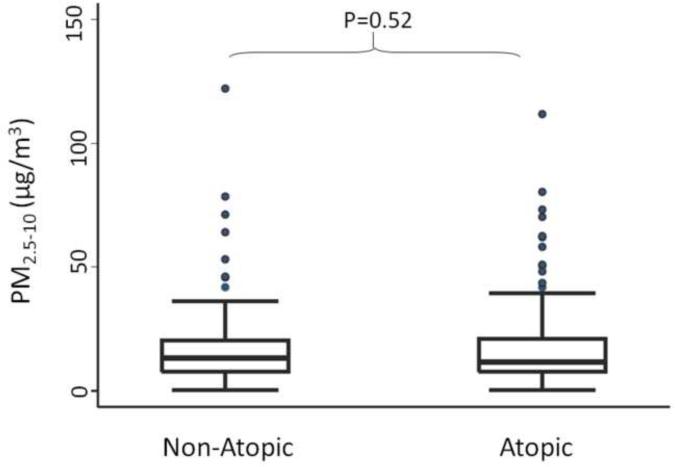
Figure 1.
Indoor coarse PM concentrations in the homes of non-atopic and atopic children. Boxes show the interquartile range (IQR) and the heavy dark lines are the median values. Whiskers represent the closest value within 1.5 times the IQR. Indoor concentrations of coarse PM did not significantly differ between non-atopic and atopic children.

