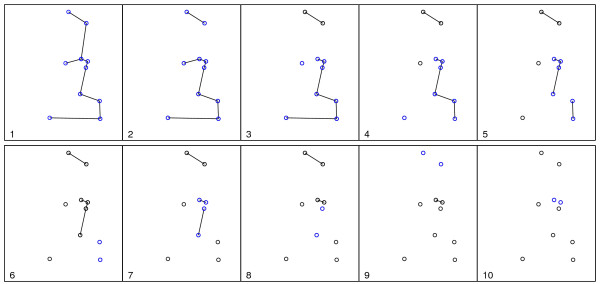
Figure 2.
Visualization of the greedy edge deletion procedure, in successive steps numbered from 1 to 10. Sub-graphs linking blue circles represent the new cluster candidates that appear in each iteration, and sub-graphs linking black circles represent cluster candidates that have already appeared in former steps.

