
Figure 9.
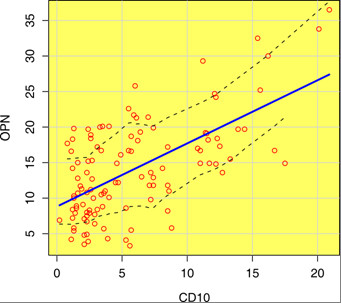
Pearson's correlation of CD10 with OPN showing the trend line and least square lines (dotted).
Official websites use .gov
A
.gov website belongs to an official
government organization in the United States.
Secure .gov websites use HTTPS
A lock (
) or https:// means you've safely
connected to the .gov website. Share sensitive
information only on official, secure websites.
Pearson's correlation of CD10 with OPN showing the trend line and least square lines (dotted).