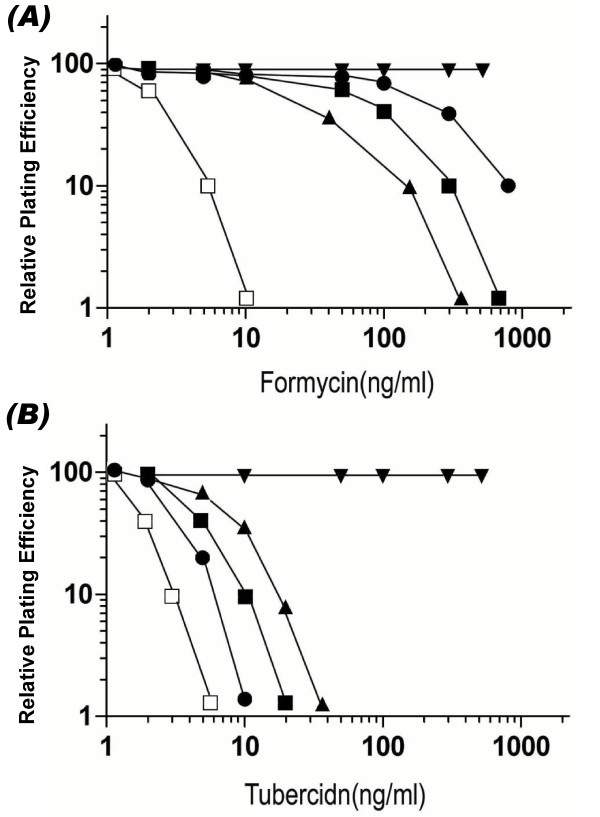
Figure 6.
Dose response curves for (A) Formycin A and (B) tubercidin for the WT CHO (□), FomR-4 (●) and ToyR-4 (▼) cell lines and for one transformant clone selected from WT (■) and ToyR-4 (▲) cell lines after transfection with the expression plasmid containing AdK(Ser191Phe) mutation. Similar results were obtained in at least 2 independent experiments.

