
Figure 2.
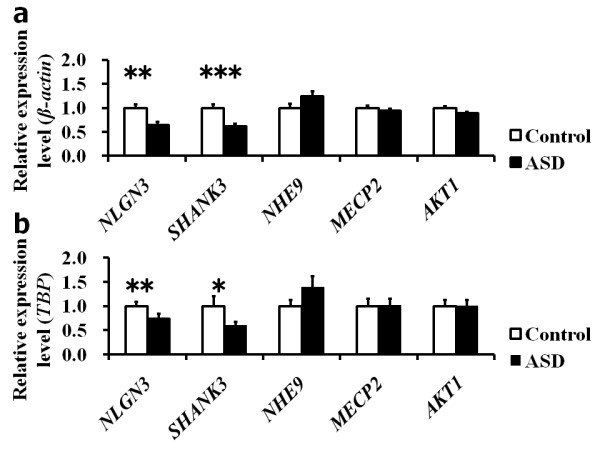
Expression analysis of NLGN3, SHANK3, NHE9, MeCP2 and AKT1 in autism spectrum disorder. Mean relative mRNA expression level scores normalized by housekeeping gene β-actin (a) or TBP (b) in the autism spectrum disorder (ASD) group and the control group are shown. Bars represent the standard error of the mean. Differences between the groups in expression levels of the five genes were analyzed by using the Mann-Whitney U test. Post hoc comparisons were performed by using the Bonferroni correction. **P < 0.01 and ***P < 0.001.