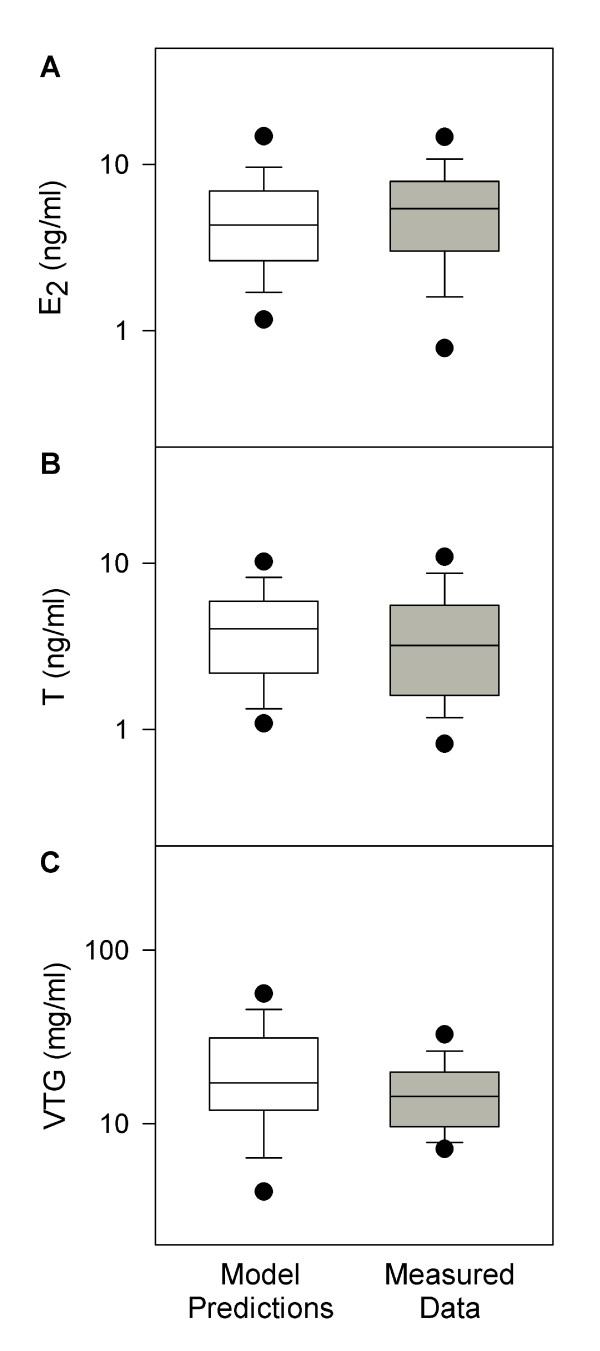
Figure 3.
Comparison of model predictions with measured data in unexposed female FHMs. n = 95. White boxes represent model predictions, and grey boxes represent measured data [38]. The solid line within the box marks the median; the boundary of the box farthest from zero indicates the 75th percentile; the boundary of the box closest to zero indicates the 25th percentile; the whisker (error bar) farthest from zero marks the 90th percentile; whisker (error bar) closest to zero marks the 10th percentile; the circle farthest from zero marks the 95th percentile; and the circle closest to zero marks the 5th percentile.

