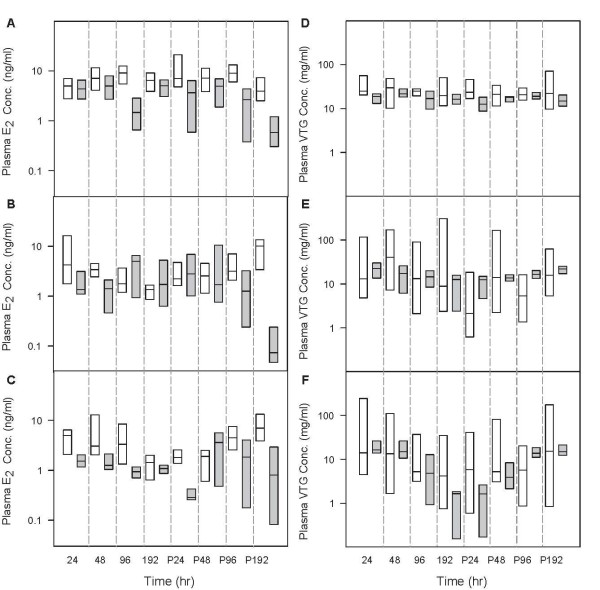
Figure 5.
Comparison of model predictions with measured data in female FHMs exposed to TB for eight days followed by an eight-day depuration. n = 8 at each sampling time. White boxes represent model predictions, and grey boxes represent measured data [40]. The solid line within the box marks the median; the boundary of the box farthest from zero indicates the 75th percentile; the boundary of the box closest to zero indicates the 25th percentile. Because of the small data size (n = 8), the plots only show the 50% confidence intervals. (A) plasma E2 concentrations in control FHMs, (B) plasma E2 concentrations in FHMs exposed to 0.05 μg TB/L, (C) plasma E2 concentrations in FHMs exposed to 0.5 μg TB/L, (D) plasma VTG concentrations in control FHMs, (E) plasma VTG concentrations in FHMs exposed to 0.05 μg TB/L, (F) plasma VTG concentrations in FHMs exposed to 0.5 μg TB/L. The x-axis represents time in hours. P24, P48, P96, and P192 represent 24, 48, 96, and 192 hours post-exposure, respectively.

