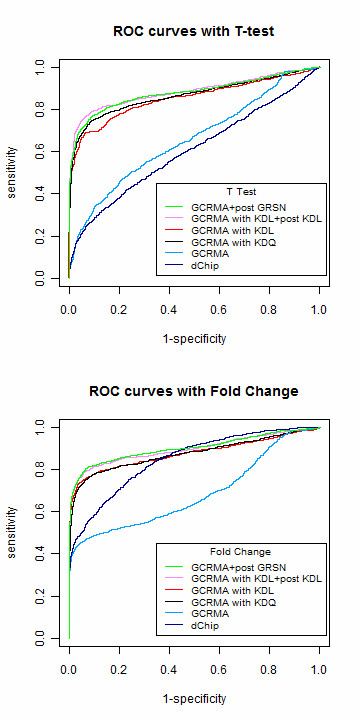
Figure 5.

ROC curves without the empty sets. For the probe level data, quantile normalization is substituted with either KDL or KDQ in the workflow of GCRMA. They are shown as red and black curves, respectively. Original GCRMA is in light blue. The upper panel uses fold change and the lower panel uses T-test as the criterion to select differentially expressed genes. The two post summary normalizations are GRSN and double KDL, which adopts KDL normalization at both probe level and post summary level. They are shown as pink and green curves, respectively.
