Figure 7.

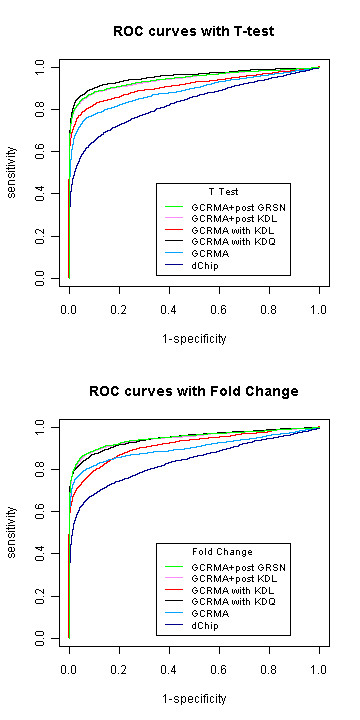
ROC curves on simulation data with asymmetric expression change. The data is simulated with 10% of significant genes as described in the context. All the treatment effects are positive.

ROC curves on simulation data with asymmetric expression change. The data is simulated with 10% of significant genes as described in the context. All the treatment effects are positive.