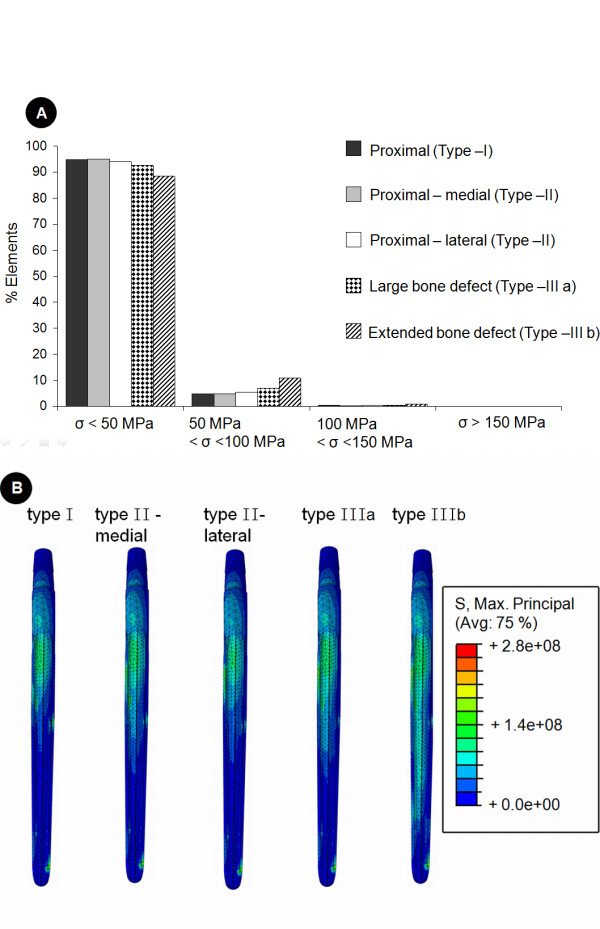
Figure 3.

Implant stresses within the standard design prosthesis as a function of the extent of the bone defect. This figures shows the effect of the extent of bone defect on the tensile stresses within the standard prosthesis (34 mm femoral offset) implanted at 4° of femoral anteversion. In image A (top), a histogram of the implant stresses is shown. Here, for each bone defect simulation implant elements were grouped according to their maximum principle (i.e. tensile) stress (denoted by the symbol σ) and are presented as a percentage of the total number of elements in the implant. Image B (bottom) shows the stress distribution along the lateral aspect of the implant for bone defects of increasing extent.
