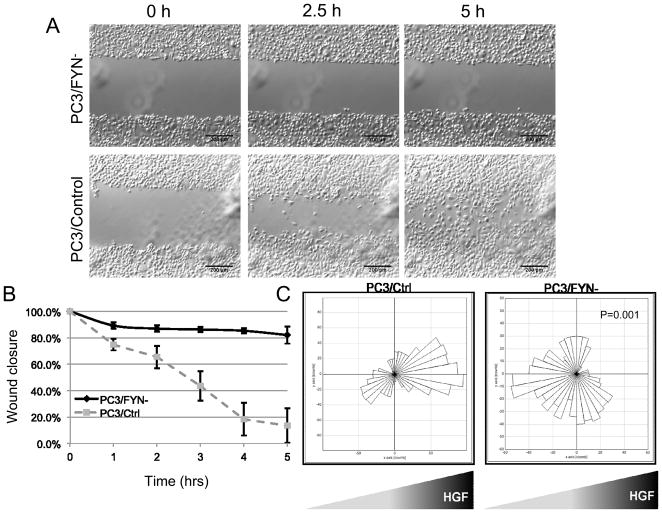
Figure 2.
Wound healing assays of PC3/FYN- and PC3/Ctrl cells in serum replete media. Full videos are available in the supplemental data. A) Representative images from time lapse video. B) Graphical representation of wound closure over time. Error bars represent standard deviation of wound closure as a percentage of the original wound distance taken at 5 serial points. C) Rose plots (circular histogram) showing collective number of steps in any given direction (in 10-degree increments) in the presence of an HGF gradient.

