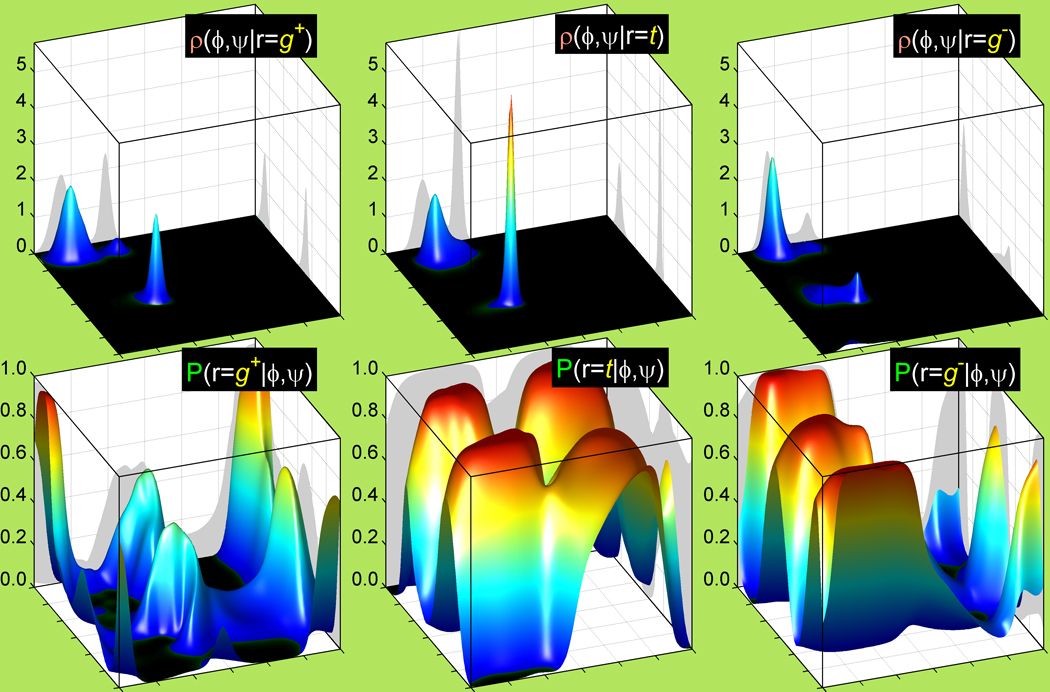
Figure 3. Rotamer Ramachandran densities and their corresponding backbone-dependent rotamer probabilities from the new 2010 Rotamer Library.

Top: Smoothed Ramachandran probability density functions (PDFs) of the backbone conformation (ϕ, ψ) for g+, trans and g− rotamers (left to right) of Val computed with Adaptive Kernel Density Estimation. ϕ and ψ are plotted along x-axis and y-axis respectively within their standard limits of (−180°, 180°). The PDFs are plotted along the z-axis and scaled in 1/radian2. For every rotamer the density integrates to 1 over the whole Ramachandran area. Bottom: Corresponding 2010 smooth backbone-dependent rotamer probabilities, calculated by inverting the Ramachandran densities in the top row with Bayes’ rule. The probabilities of all three g+, t and g− rotamers sum up to 1 for every (ϕ, ψ). The Val bandwidth radius is 5° and the concentration parameter, κ is 120. These values match the 5% stepdown from the optimal log-likelihood score for additional smoothness with the best SCWRL4 prediction rates (see Results).
