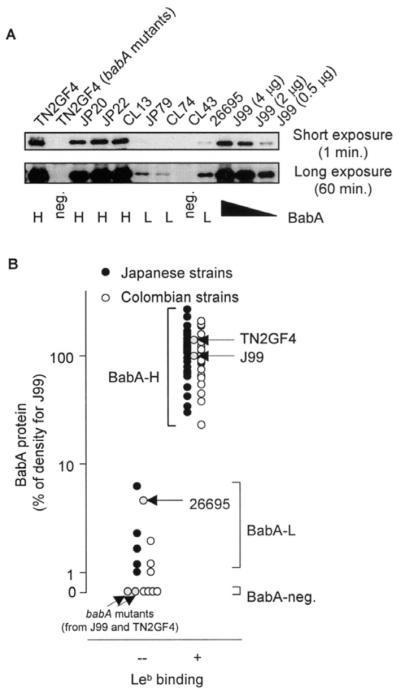
Figure 2.
Immunoblot analyses of BabA protein levels. (A) Semiquantitative analyses for BabA protein levels. For semiquantitation, 4, 2, and 0.5 μg of protein extracted from strain J99 was transferred to each membrane along with 4 μg of protein extracted from each experimental strain. The density of the detected band was expressed numerically using Image J 1.36 software (National Institutes of Health). A BabA band was not observed in strain JP79, strain CL74, or strain 26695 (upper panel) after short exposure, whereas the BabA band clearly appeared after longer exposure (lower panel). This result suggests that these strains produced the BabA protein (2.6%, 1.3%, and 6.1% relative to the amount of BabA produced in strain J99 [4 μg]). In contrast, the BabA band did not appear, even after long exposure, in the isogenic babA mutant strains TN2GF4 and strain CL43. Strain names beginning with JP signify strains from Japanese patients; CL signifies strains from Colombian patients. (B) Relationship between the density of BabA band (BabA protein levels) and Leb binding activity. Three groups can be distinguished clearly based on BabA expression levels.

