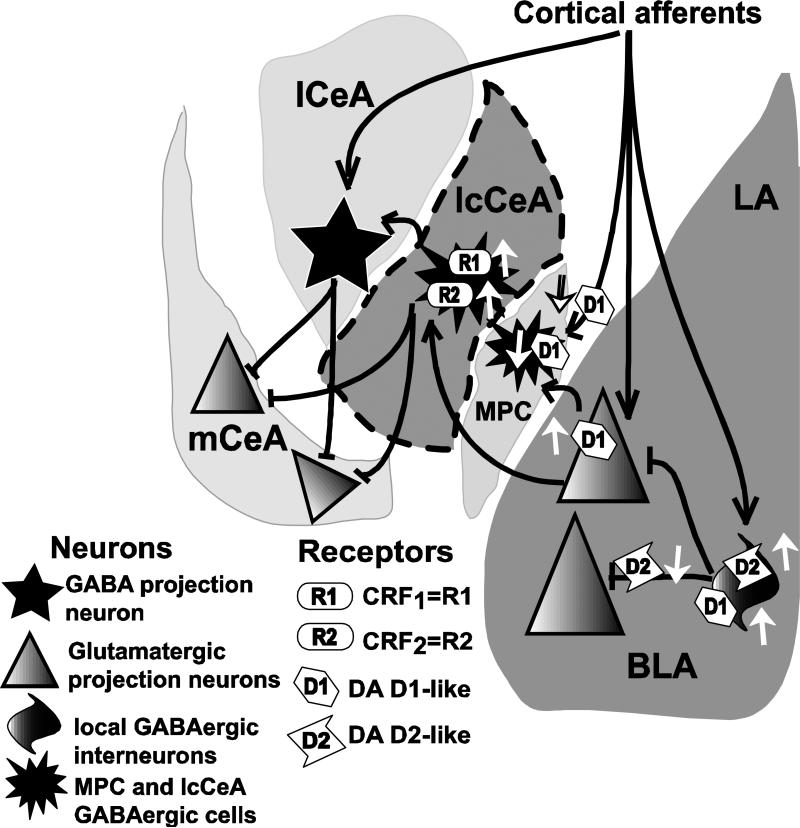
Figure 12.
Schematic diagram illustrating previously published DA actions and the effects of CRF application on fEPSP responses in the lcCeA recorded in the present study (see text). LA=lateral amygdala; BLA=basolateral amygdala; D1, D2=DA receptors; R1, R2=CRF receptors; MPC=medial paracapsula neurons; mCeA=medial central amygdala; lCeA=lateral CeA; lcCeA=lateral capsula CeA. Area within the dotted lines represents the region and the synaptic connections characterized in the present study. Black lines with arrowheads represent excitatory synapses while dark lines with flatheads represent inhibitory inputs. White arrows pointing upwards indicate increased activity of the receptor while those pointing downwards indicate reduction in activity. DA receptors are located on local (feed-forward) GABAergic interneurons (D1/D2, facilitatory), presynaptic receptors (D2, inhibitory), and pyramidal glutamatergic projection neurons (D1 facilitatory), in the BLA and MPC (D1, postsynaptic, inhibitory and D1, presynaptic, inhibitory). CRF1 and CRF2 receptor effects in this study, recorded from inhibitory GABAergic lcCeA neurons are stimulatory. The upregulation of CRF1 and CRF2 receptors in the lcCeA can then act on the GABAergic and non-GABAergic neurons in the lCeA and the mCeA (depicted in separate respective nuclei only for illustrative purposes) leading to downstream stimulation of target neurons involved in reward and emotion. In this model, when GABAergic inhibition is decreased, D2R effects are absent suggesting their primary influence in the enhanced CRF-induced LTP is to presynaptically block inhibitory BLA interneurons (see Bissiere et al., 2003). Cortical afferent input, as observed in other studies, is depicted here to show that there are additional levels of regulation present within the pathway.

