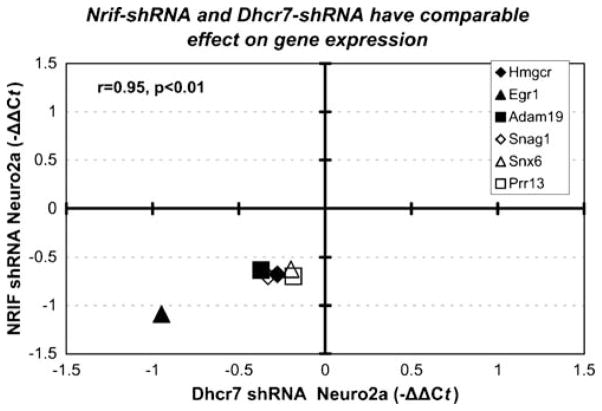
Figure 4.
NRIF-dependent transcript changes are similar to those observed in Dhcr7-deficient Neuro2a cells. Both axes denote the average −ΔΔCt from three independent experiments, two independent reverse transcriptions for each experiment and four replicates for each RT. −ΔΔCt was calculated against Pgk1 as a normalizer. X-axis values are derived form qPCR analysis of Dhcr7-shRNA-transfected Neuro2a cells (Korade et al. 2008; minor revisions); Y-axis values are derived from qPCR analysis of stably transfected NRIF shRNA Neuro2a cells. Each symbol represents a single gene. Note that the expression changes were virtually identical across both systems (r= 0.95, p<0.01)

