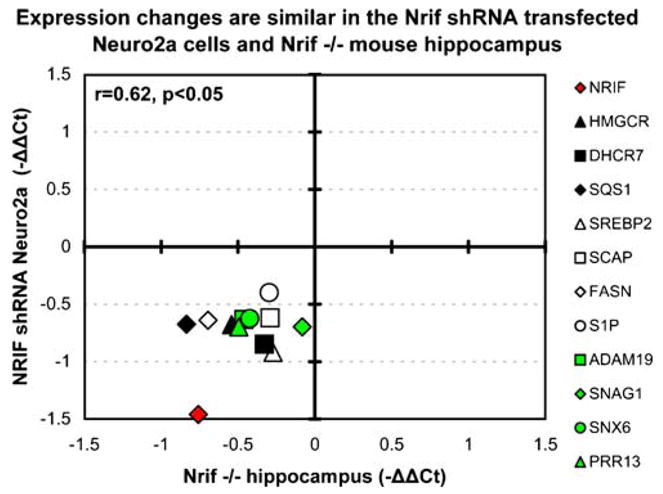
Figure 6.

Transcript changes are similar in NRIF-shRNA expressing Neuro2a cells and NRIF−/− mice. The figure layout is similar to that in Fig. 4 Black symbols denote cholesterol biosynthesis genes, white symbols correspond to genes with SRE binding domain, while green symbols denote Dhcr7-regulated genes. Note that all of these gene expression changes in the NRIF-shRNA expressing Neuro2a cells are highly correlated to those observed in hippocampus of 7-day old NRIF KO mice (r=0.62, p<0.05)
