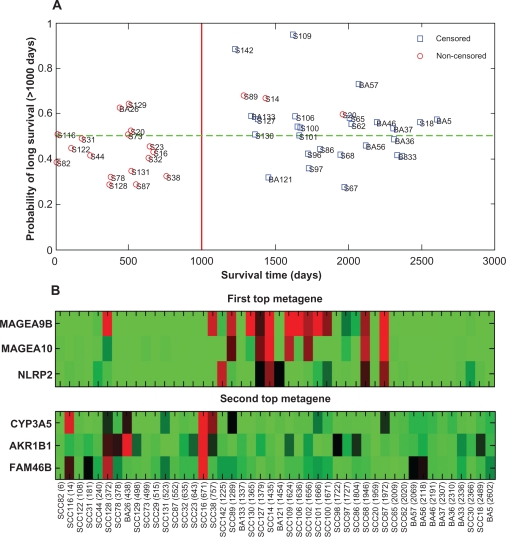
Figure 2.
A) Leave-one-out cross-validation results demonstrating the ability of the model to classify new Ib patients into groups of low and high survival risk. The y-axis gives the posterior probabilities that a patient is classified into the long survival group (survival time > 1000 days) and the x-axis gives the observed survival time (including censored times). AC and BC patients are denoted by BA and SCC patients by S. Patients above the 0.5 posterior probability line (green dotted line) are classified into the long survival (low risk) group and patients below the line are classified into the short survival (high risk) group. B) A heatmap presentation of the two top metagenes most frequently found to be associated with the two risk groups in the Bayesian model. The genes included into the metagenes are listed on the y-axis and the patients sorted according to their survival times (days) are listed on the x-axis. High gene-expression values are shown with red color and low values with green (
 ).
).

