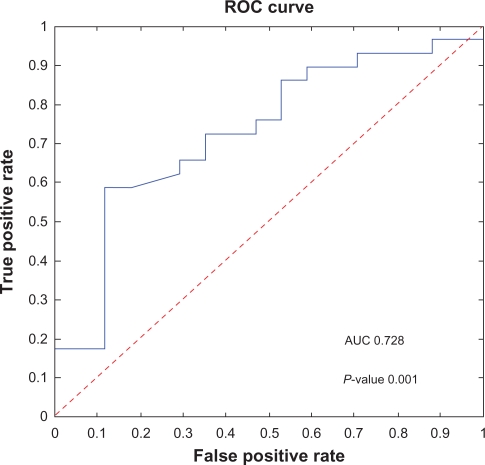
Figure 3.
The empirical ROC curve (solid curve): The true positive rate plotted as a function of the false positive rate for different cut off values. Jumps in the curve correspond to changes in the classification outcome of the patients due to the use of different cut off values. For cut off value 0 all patients are classified into the long survival group, FTP = 0 and TPR = 0. In the other extreme, ie, cut off value 1 all patients are classified into the short survival group, FTP = 1 and FPR = 1. The area under the curve (AUC = 0.728, P-value 0.001) is an overall measure of the quality of the classification method. The dashed line (AUC = 0.5) is the expected ROC curve for a totally random classifier.

