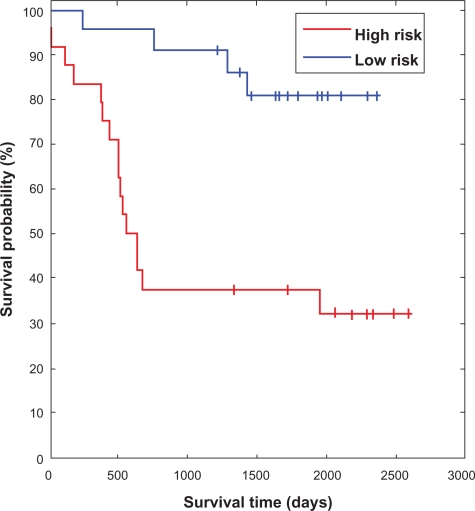
Figure 4.
Kaplan-Meier plot of the survival probability in the high and low risk groups predicted by the Bayesian model. The high risk group (short survival) consisting of 24 patients and the low risk group (long survival) consisting of 22 patients. Vertical drops indicate deaths and ticks on the solid lines are censored survival times. The survival rates of the two groups are significantly different (P = 0.0007).

