Figure 4.
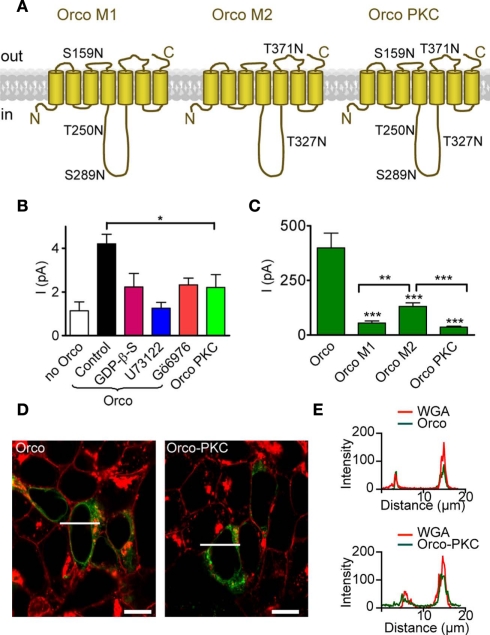
Mutation of PKC phosphorylation sites in Orco reduces the resting current and cAMP responses. (A) Scheme of Orco topology with mutations of PKC sites indicated in the three mutants Orco M1, Orco M2, and Orco PKC. Two sites are predicted to be in extracellular loops (ECL2 and ECL3) while three sites are in the intracellular loop 2. (B) Mean inward currents in inside-out patches from non-transfected HEK293 cells (n = 12), cells expressing Orco and Orco PKC, measured at −60 mV without stimulation. The constitutive current through Orco (Control, n = 43) was reduced by GDP-β-S; (500 μM, n = 13, *P < 0.05, Student’s t-test.), U73122 (10 μM; n = 10, **P < 0.01), and Gö6976 (1 μM; n = 8, *P < 0.05), and it is significantly larger than in patches from non-transfected HEK293 cells (***P < 0.001). Compared with Orco PKC containing patches (n = 15), only the Orco current in the control is significantly larger (*P = 0.02). (C) Whole-cell current responses to 5 μM 8-br-cAMP in cells expressing Orco (WT) or the three PKC mutants, measured at −100 mV. (WT, n = 11; M1, n = 10; M2, n = 15; Orco PKC, n = 11; −4, ***P < 0.001; Student’s t-test). Currents in M2 expressing cells are significantly larger than in M1 (**P = 0.002) or Orco PKC (***P < 0.001) expressing cells. Error bars represent SEM. (D) Confocal micrographs of HEK293 cells transfected with Orco and Orco PKC. Green, immunofluorescence; red, Texas-red fluorescence of wheat germ agglutinine (WGA) labeled plasma membrane; bar, 10 μm; line indicates position of intensity profile shown in (E). (E) Intensity profile of Orco and Orco PKC immunfluorescence and membrane staining (WGA-Texas-red) in two cells displayed in (D). Colocalization of fluorescence signals indicates membrane insertion of the Orco proteins.

