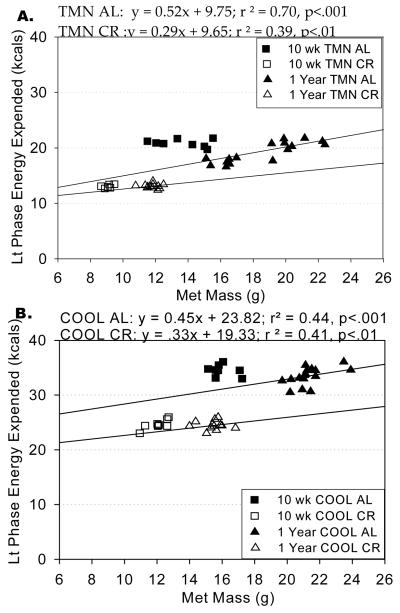
FIGURE 3.
Linear regression of metabolic mass on light phase energy expenditure for groups of rats housed in thermoneutral (TMN; Ta = 30°C) or cool (COOL; Ta=15°C) conditions and studied during ad libitum (AL) or caloric restriction (CR) feeding conditions. Graph points indicate individual animal values for metabolic mass and corresponding light phase energy expenditure after 10 wks or one year of CR. Best-fit lines are included for each dietary treatment. The equation for each best-fit line is displayed above the graph.

