Figure 2.
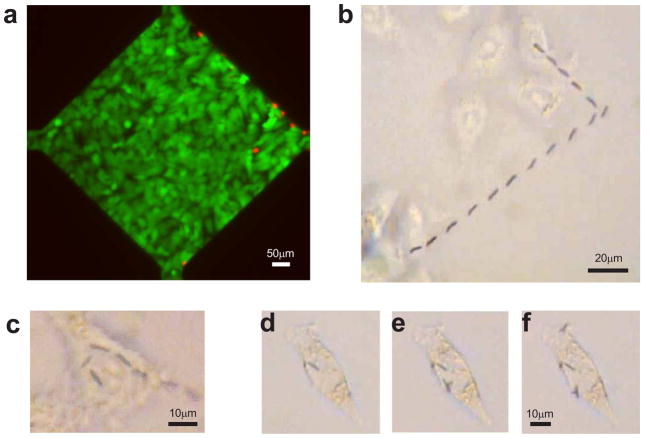
Nanowire delivery to pre-selected cells. a, Live (green) and dead (red) cell staining showing that typical voltages used to manipulate nanowires does not affect the viability of most cells in the operating area. Dead cells were confined to the areas immediately adjacent to the electrodes. b, Overlay of a time series of phase contrast images showing delivery of a single nanowire to the cell at the top of the image. (See also Supplementary Movie 2.) c, Overlay of a time series of phase contrast images showing delivery of a single nanowire to sub-divisions of the same cell. (See also Supplementary Movie 3.) d–f, Phase contrast images showing sequential delivery of nanowires to a single cell.

