Figure 4.
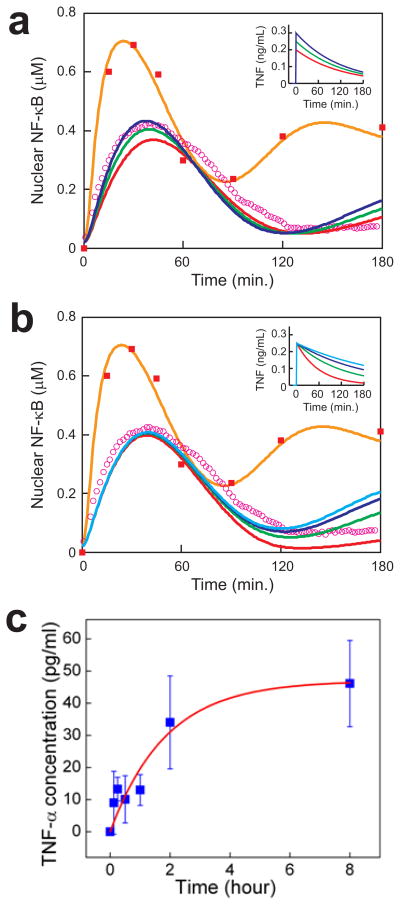
Simulations predict localized TNF α delivery. a,b, The simulated response to 10ng/mL TNF α (orange) compares well with experiment (red squares, same as Fig. 3a). Simulated responses to TNF α inputs of the form c(t) = cos exp(−t/tos) (t > 0) are shown. In panel a, tos = 120 min. and cos = 0.20 (red), 0.25 (green), 0.30 (blue) ng/mL. In panel b, cos = 0.25 ng/mL and tos = 60 (red), 120 (green), 180 (blue), 240 (light blue) min. The green curves give the best fit to experiment (magenta circles, same as Fig. 3a). See Methods for the model description. c, TNF α-desorption kinetics determined by ELISA measurements of TNF α concentration in the supernatant of a solution of 5×10⁶ nanowires/mL. See text for description of the fitted exponential curve (red).

