Figure 3.
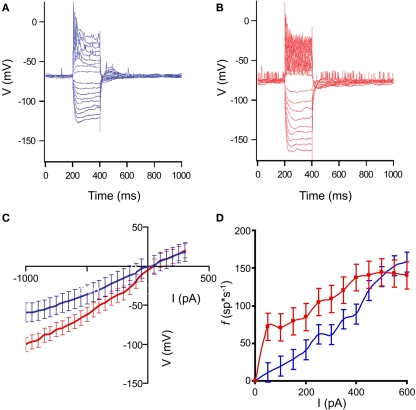
Input–output characteristics of control and HD neurons. (A,B): Representative responses of neocortical neurons to intracellular current pulses. Each trace shown is an average response to eight stimuli. Pulses ranged from ±100 to 1000 pA in amplitude, and 200 ms duration. (A): non-transgenic littermate control neuron; (B): R6/2 neuron. In the examples shown, the animals were 9 weeks of age. Note the increased voltage responses in the HD neuron, indicating higher input resistance, as well as the increased spiking, indicating higher response frequency. (C): Average current–voltage plots of control (blue) and HD (red) neurons. Error bars represent between-neuron SD. Note the increased slope of the HD I/V curve. (D). Average excitation-to-frequency (f/I) plots for control (blue) and HD (red) neurons. Error bars represent between-neuron SD. The lines are smoothed between the measured points. Note the increase in the f/I slope in the lower part of the range, indicating that the HD neurons have smaller dynamic response ranges, and tend to respond abnormally to relatively weak stimuli.

