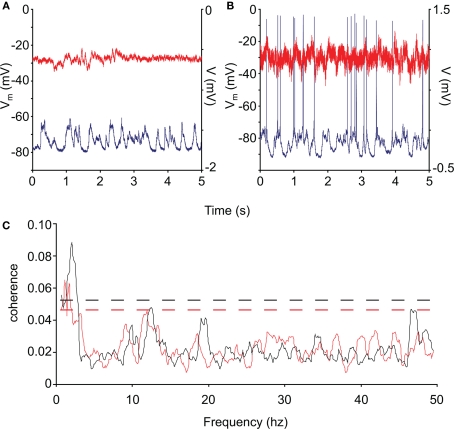
Figure 4.
Coherence of control and R6/2 neocortical activity. (A,B) Representative intracellular recordings (blue) and ECoG (red) from control and R6/2 mouse cortex. (C): average neuronal/neocortical coherence for the control (black trace) and HD (red trace) neurons. The coherence of the HD membrane potential with the global activity represented by the ECoG is significantly less than that of the controls in the low-frequency range (<5 Hz), which represents the state transition activity. The dashed lines represent the 95% confidence intervals of the spectra.

