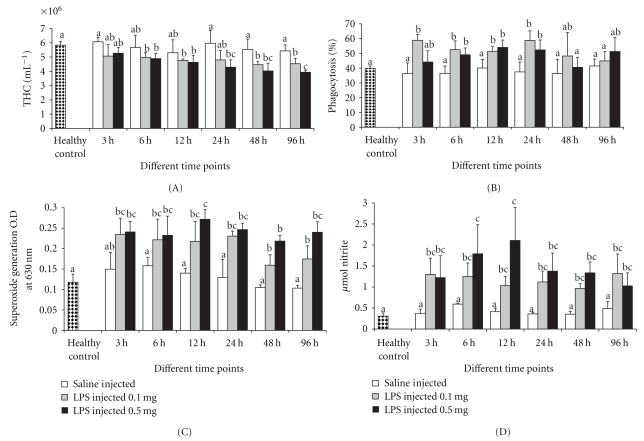
Figure 1.
The effect of LPSs on (A) THC, (B) percent phagocytosis, (C) superoxide anion generation, and (D) nitric oxide. Data, representing the mean ± S.D. of 3 determinations using samples from different preparations, were analyzed using ANOVA followed by the Tukey post hoc test. The same letters (a, b, and c) indicate no significant difference between challenge groups at different exposure periods, whereas different letters indicate statistically significant differences (P ≤ .05) between different exposure periods and groups.

