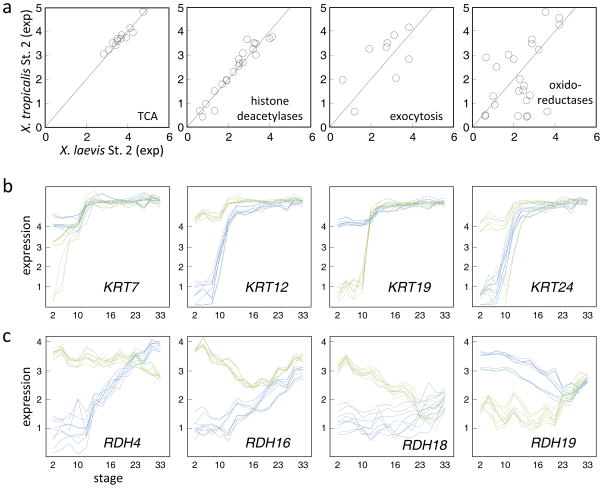
Figure 6. Comparison of the maternal transcriptomes of X. laevis and X. tropicalis.
a. For each of four functional gene sets, the plot compares the expression levels (log10 relative concentrations) in stage 2 embryos between the two species. b. Comparative gene expression profiles of four keratin genes. These genes are less than 80% identical at the protein level allowing good resolution by the microarray data. KRT24 in X. tropicalis exhibits two patterns depending upon the probes examined: one with maternal expression and another with a profile heterochronic to the X. laevis ortholog. c. Comparative gene expression profiles of four retinol dehydrogenases.

