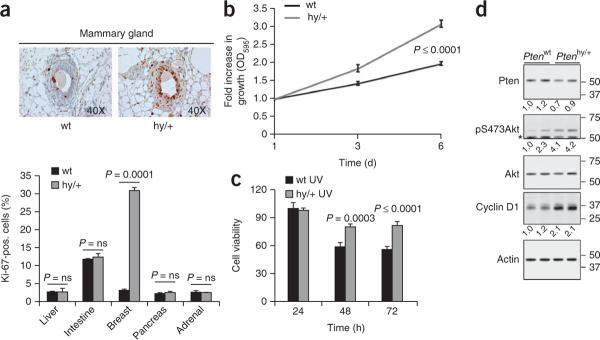
Figure 2.
A subtle variation of Pten gene expression promotes hyper proliferation in a tissue-specific manner. (a) Representative images of mammary tissue (above) and quantification (below) of Ki-67 staining in tissues from 2-month-old Ptenwt and Ptenhy/+ littermate mice. P, statistical significance; error bars, s.d. (b) Growth curve analysis of Ptenwt and Ptenhy/+ mouse mammary epithelial cells. Error bars, s.d. (c) Analysis of the cell viability (at the indicated time points) of Ptenwt and Ptenhy/+ mouse mammary epithelial cells after treatment with ultraviolet irradiation (at 60 J/m2). (d) Protein blot analysis for Pten, pAkt and Cyclin D1 protein levels in Ptenwt and Ptenhy/+ MMECs. Asterisk indicates residual Pten signal that is present because the membrane was not stripped prior to blotting for pAkt. Numbers to the right of the blots represent molecular weight markers in kDa; those numbers below the blots indicate densitometrically quantified protein levels for Pten (normalized to β-actin) and pAkt (normalized to total Akt). Presentation of cropped images is in accordance with Nature Publishing Group policy.

