
Figure 5.
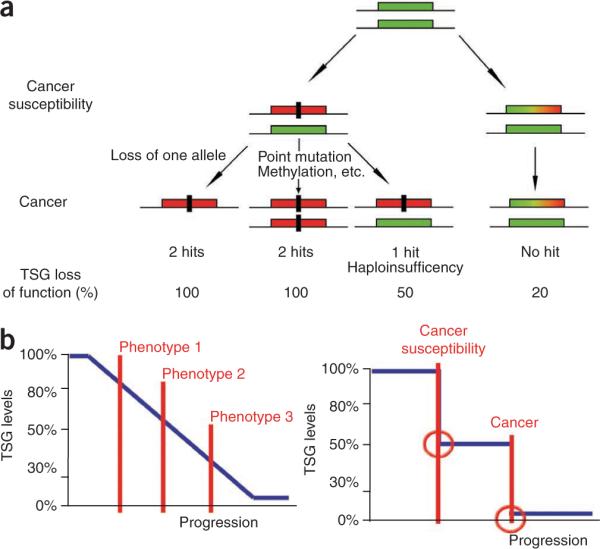
Implications for tumorigenesis upon subtle reduction of TSG levels. (a) The `no hits' model of cancer susceptibility. The rectangular green box represents a functional allele of a given TSG. The rectangular red box represents a nonfunctional allele inactivated by, for example, mutation or deletion. The rectangular green, yellow and red box represents an allele of a TSG whose expression is reduced below the normal levels. The black rectangle represents a genetic hit. Note that the model represented does not exclude the presence of additional hits on other loci. (b) A continuum model (left) for cancer initiation and promotion vis-à-vis a saltatory model (right). Note that in the continuum model, even subtle reductions in the dose of a TSG can initiate tumorigenesis in a tissue-specific manner. Phenotypes 1, 2 and 3 indicate that with the reduction of the TSG dose, the tumor phenotype can change in a tissue-specific manner, increasing incidence and aggressiveness of the disease. In the saltatory model, cancer arises from a stepwise genetic mutation–driven allelic loss.