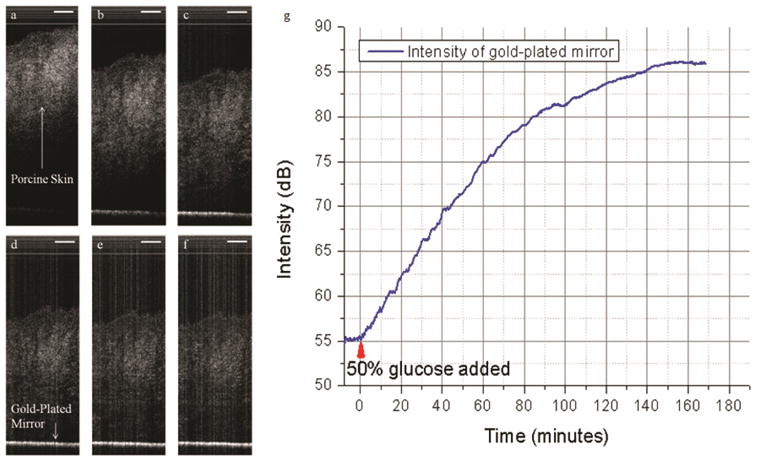
Fig. 2.

Monitoring intensity changes of gold mirror due to optical clearing of porcine skin using 50% glucose solution. (a) 2D image at the instant of addition of glucose solution. (b)–(f) 2D images acquired after 35, 70, 105, 140, and 165 minutes from the addition of glucose solution. (g) Intensity of light reflected from the mirror with time. Time t = 0 minutes corresponds to the time of addition of glucose. Scale bar = 250 μm.
