Fig. 2.
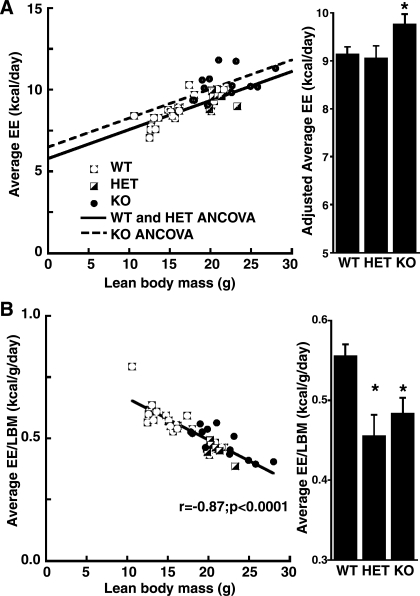
Adjusted energy expenditure (EE) in relation to lean body mass (LBM) in KO mice and controls (HET and WT). A: the scatterplot shows lines of best fit for EE as a function of group and LBM using analysis of covariance (ANCOVA). The EE fit line for KO mice (dashed line) is higher than that for WT and HET controls (solid line). Note the significant, positive y-intercept (5.63 ± 0.48 kcal/day, P = 0.00001) in the regression of EE on LBM. The bar graph shows group comparisons adjusted for LBM. *P ≤ 0.03 compared with WT or HET. B: traditional ratio normalization (division of EE by LBM) yields a confounded measurement, as demonstrated by the remaining strong negative correlation between the normalized construct and LBM. The bar graph demonstrates that KO mice incorrectly appear hypometabolic using this method. *P ≤ 0.004 compared with WT.

